
New COVID cases per million in selected East-Central-Europe countries
A mapping exercise
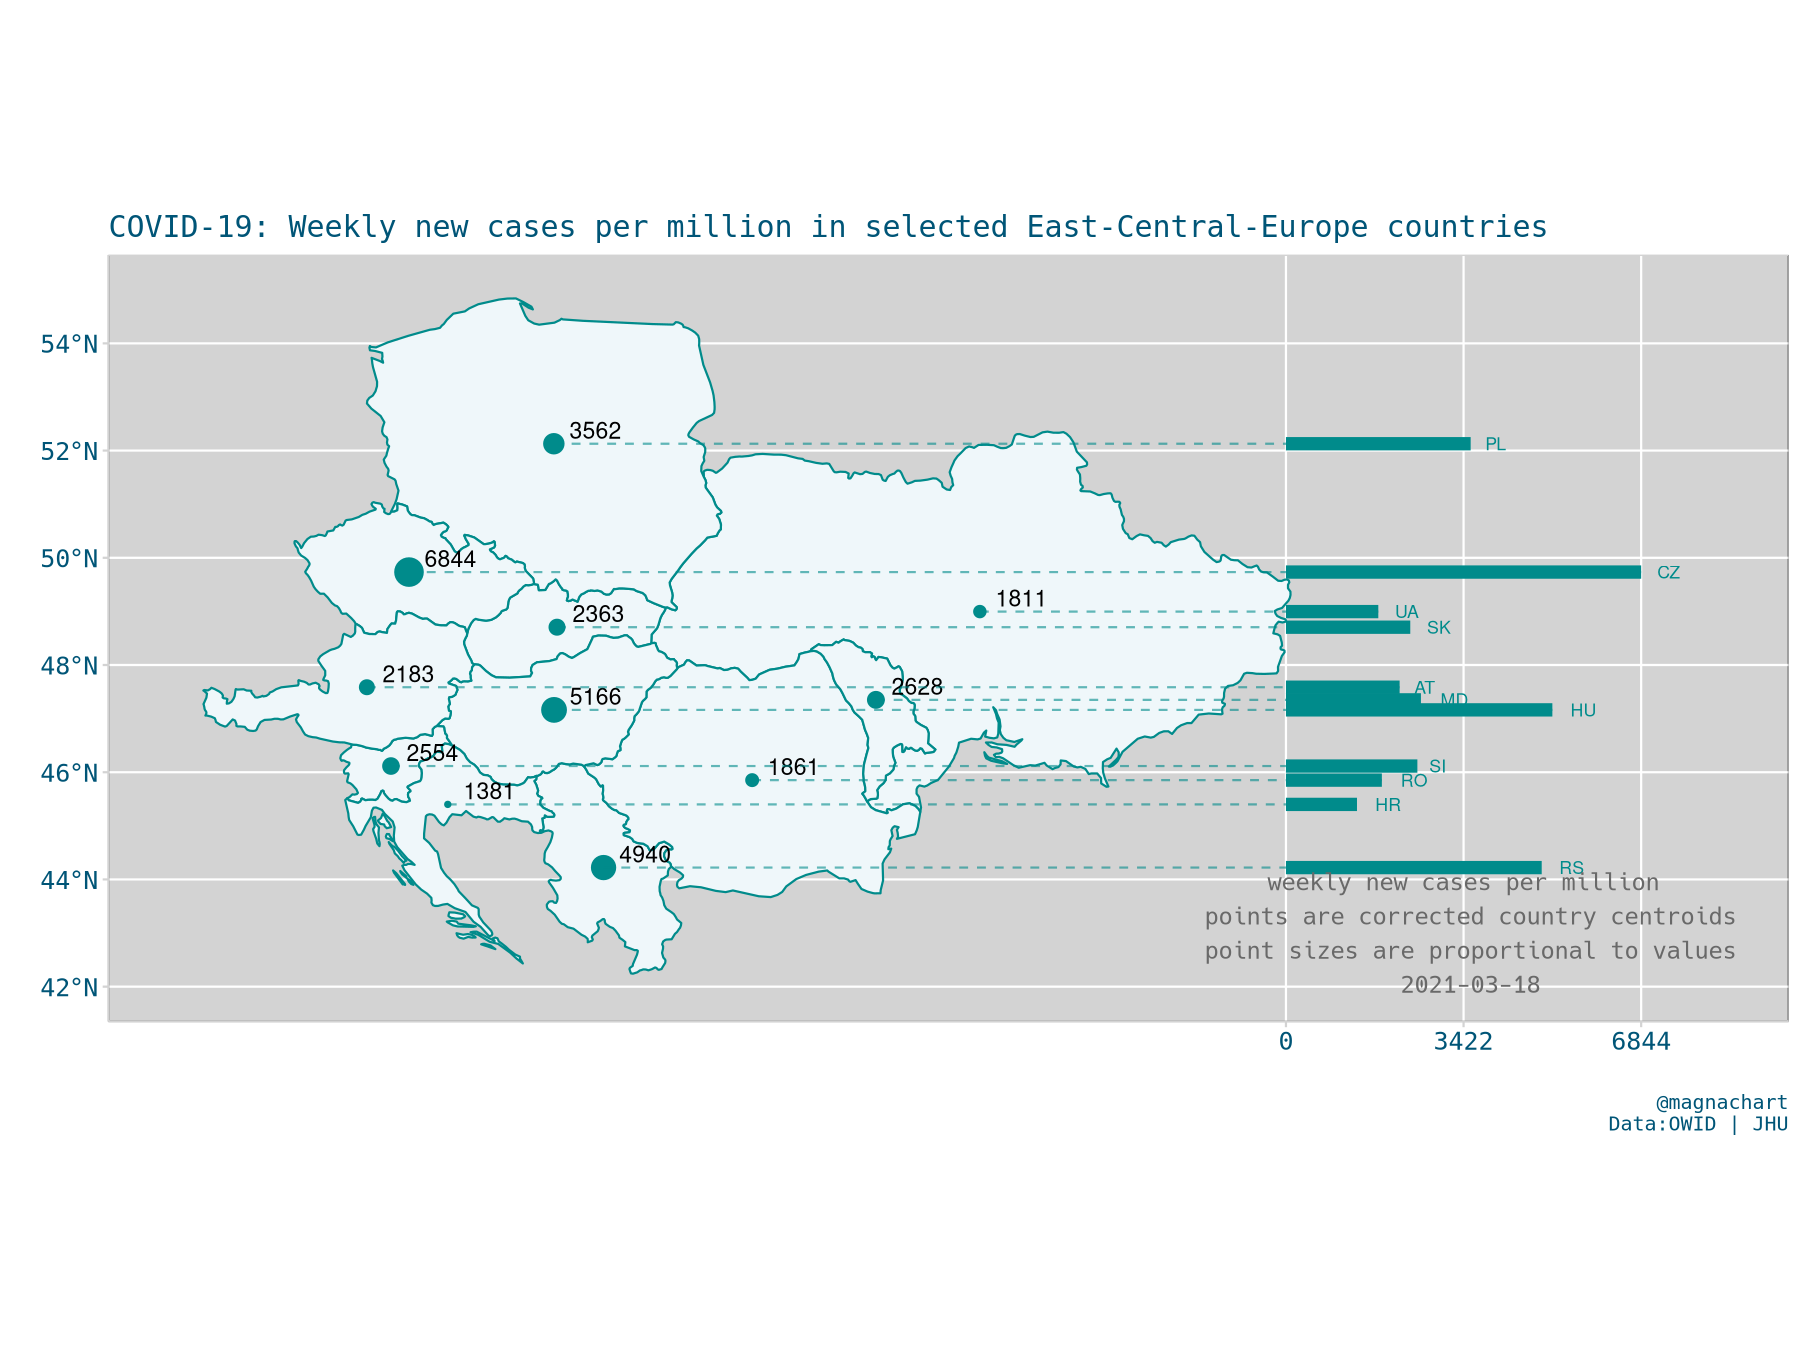
This image shows the number of new confirmed COVID cases for the previous 7 days as of 18 March, 2021.
The code is replicated from a #30DayMapChallenge submission by Jose Echave (@assesslife).
Day 8 of #30DayMapChallenge - Yellow
— Jose Maria Echave Sanz (@assesslife) November 8, 2020
Map & plot mix. Is solar energy % higher the more south we go to in Europe?
Tools: R pic.twitter.com/cH6QqljZqS