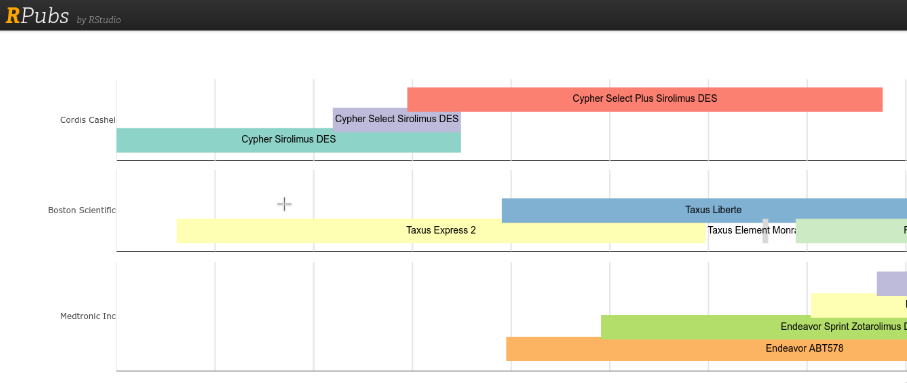
Az RStudioval könnyen készíthető idővonal (timeline) vizualizáció a vistime csomaggal.
A lehetőségekről lásd ezt a témát a StackOverflow-on. Futtatható kódrészlet:
# install.packages("vistime")
 library(vistime)
 deviceme as :buffernext :bn in normal mode.datame as :buffernext :bn in normal mode <- data.frame(
   DeviceName = c("Cypher Sirolimus DES", "Taxus Express 2", "Cypher Select Sirolimus DES",
                  "Cypher Select Plus Sirolimus DES", "Taxus Liberte", "Endeavor ABT578",
                  "Endeavor Sprint Zotarolimus DES", "Xience V", "Taxus Element Monrail ION",
                  "Xience Nano", "Promus Element Plus", "Xience Prime",
                  "Endeavor Resolute DES","Endeavor Resolute Integrity DES", "Promus Premier",
                  "Xience Xpedition LL and SV"),
   DeviceManufacturer = c("Cordis Cashel","Boston Scientific","Cordis Cashel",
                          "Cordis Cashel","Boston Scientific","Medtronic Inc",
                          "Medtronic Inc", "Abbott Vascular", "Boston Scientific",
                          "Abbott Vascular","Boston Scientific", "Abbott Vascular",
                          "Medtronic Inc", "Medtronic Inc","Boston Scientific",
                          "Abbott Vascular"),
   start_date = as.Date(c("2002-11-15", "2003-09-09", "2005-10-21",
                          "2006-10-25","2008-02-05", "2008-02-27",
                          "2009-06-10", "2009-08-21", "2011-08-19",
                          "2011-10-24", "2012-01-30", "2012-04-10",
                          "2012-04-14", "2013-03-07", "2013-09-30", "2014-02-19")),
   end_date = as.Date(c("2007-07-18", "2010-11-10", "2007-07-18",
                        "2013-04-05", "2013-11-01", "2016-03-31",
                        "2016-03-31", "2016-03-31", "2011-09-16",
                        "2016-03-31", "2016-03-31", "2016-03-31",
                        "2016-03-31", "2016-03-31", "2016-03-31", "2016-03-31")),
   stringsAsFactors = FALSE
 )
 vistime(device.data, events = "DeviceName", groups = "DeviceManufacturer",
         start = "start_date", end = "end_date")
Az eredmény elmenthető html formátumban, illetve könnyedén publikálható az Rpubs oldalakon.