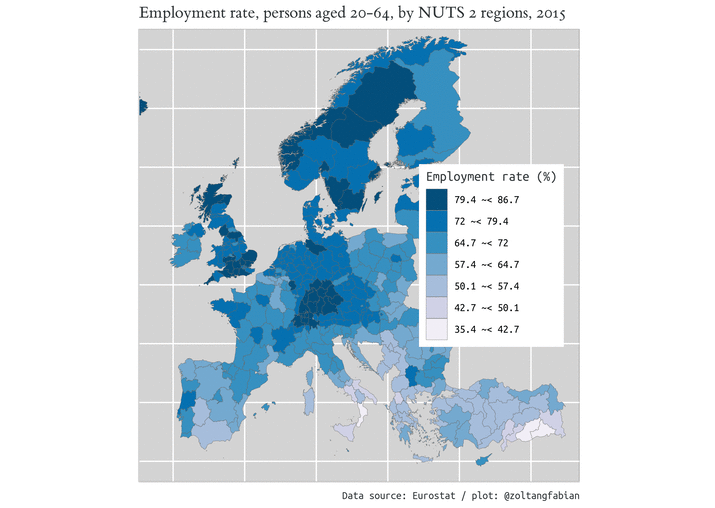
Recently, I found a post on mapping Eurostat data, which was written in 2016 by Markus Kainu. It is not too old, but an important function within {eurostat} package became obsolote since then. merge_eurostat_geodata() have been abondoned because of switching to simple features standard. After some searching I found a solution to this issue1. (It also turned out that Markus Kainu is one of the devs of {eurostat}.) So, I made some minor changes in the original code base in order to reproduce and update some of the maps on NUTS2 (regional) level.
Here they are (Click to enlarge image):
I think they are quite pretty, although not fully comparable due to different value categories.
Class struggle: Mind your objects’ classes!
Plotting sf objects is easy with ggplot and geom_sf() unless you mess your data classes. Pay special attention when you join data.frames of different classes. Consider the following scenarios:
As long as you get “sf”, you are good to go forward with geom_sf. Otherwise you’ll be stucked.
More info:
Full source as gist: